
See What You Can’t See: Boost Crop Yields with NDVI Technology
Modern agriculture increasingly relies on data and digital technologies. One of the key tools for monitoring crop conditions is the Normalized Difference Vegetation Index (NDVI), which allows farmers to quickly and objectively assess crop growth and make informed management decisions.
Every field has its own yield potential. The only question is whether you are utilizing it to its fullest. Thanks to NDVI, you can get a complete picture of crop conditions without constant trips to the field—quickly, accurately, and on time.
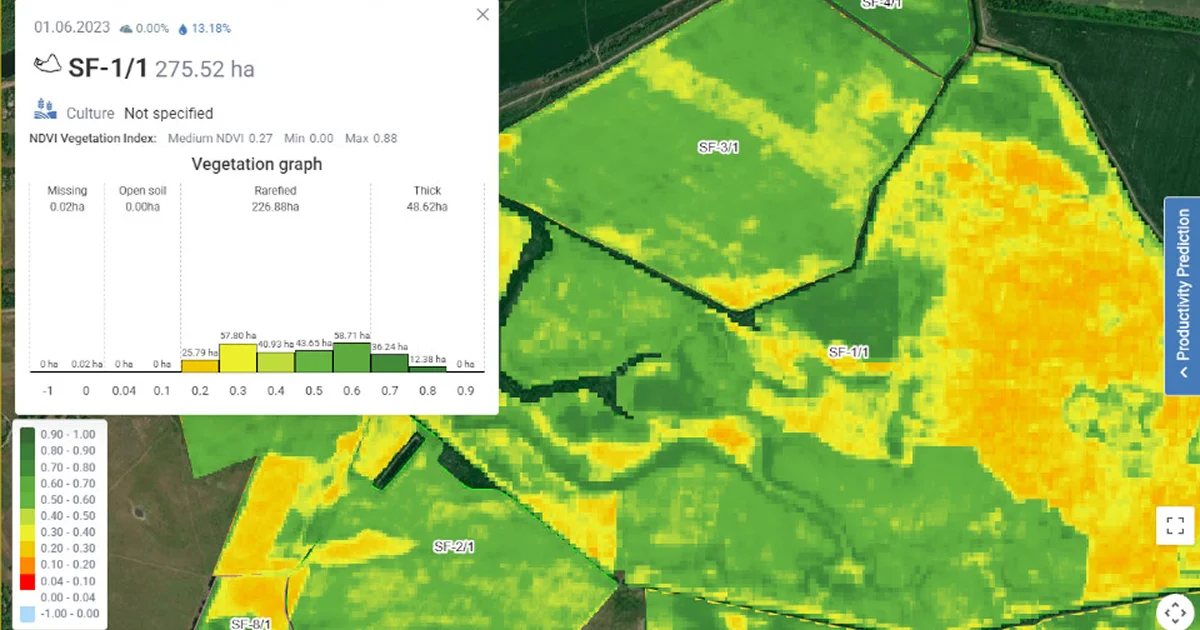
NDVI shows the actual condition of vegetation in the field. It is calculated using satellite or drone imagery and allows you to see what is not visible to the naked eye. The principle behind NDVI is that healthy vegetation actively absorbs red light while reflecting near-infrared radiation well. It is precisely this difference that NDVI relies on. As a result, you get a clear map of the field, where green areas represent strong and productive crops, yellow areas indicate those requiring attention, and red areas denote problem zones that demand immediate management decisions.
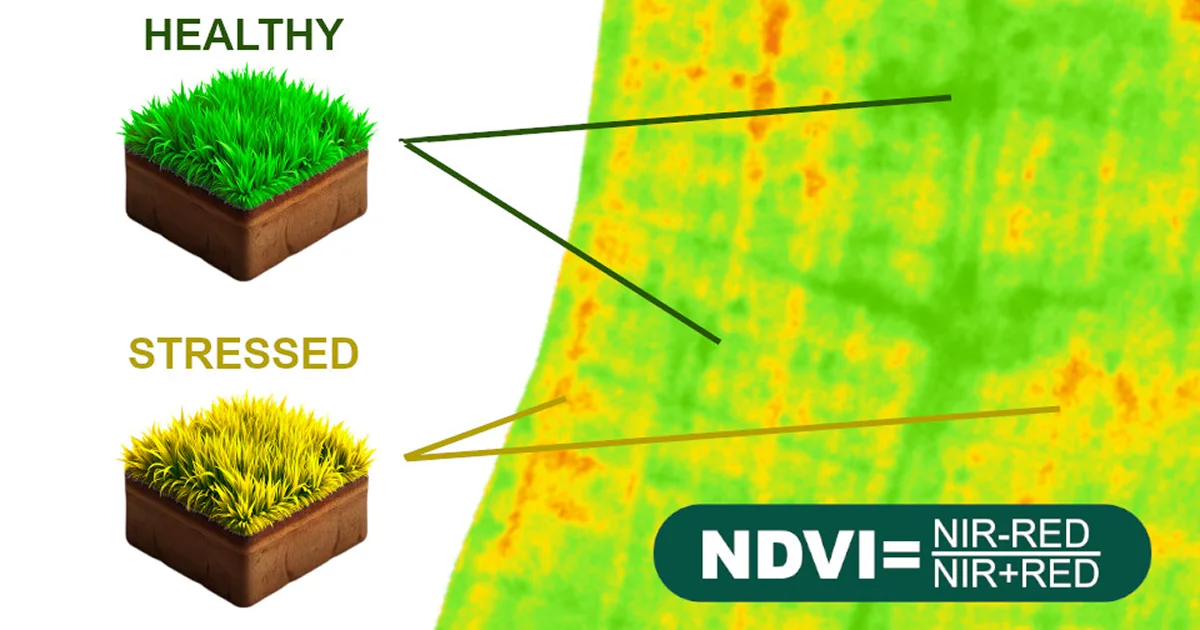
Typically, peak NDVI values are analyzed because they are closely linked to crop yield. However, focusing solely on the actual vegetation peak—which varies from year to year—limits the ability to make early forecasts and reduces their value. Therefore, additional parameters reflecting the region’s meteorological and climatic conditions are incorporated into the analysis. The broader and more reliable the input data set, the higher the forecast accuracy. Taking into account the significance of factors influencing yield, the Agroxy system uses information about the variety and previous crop, sowing and harvesting dates, actual yield figures, as well as precipitation amounts and the sum of active temperatures for the previous year and since the start of the current season in its calculations, since all this data is stored in the SF.Cloud cloud environment. Thus, NDVI allows you to see the actual condition of the field even when problems are not yet visible to the naked eye.
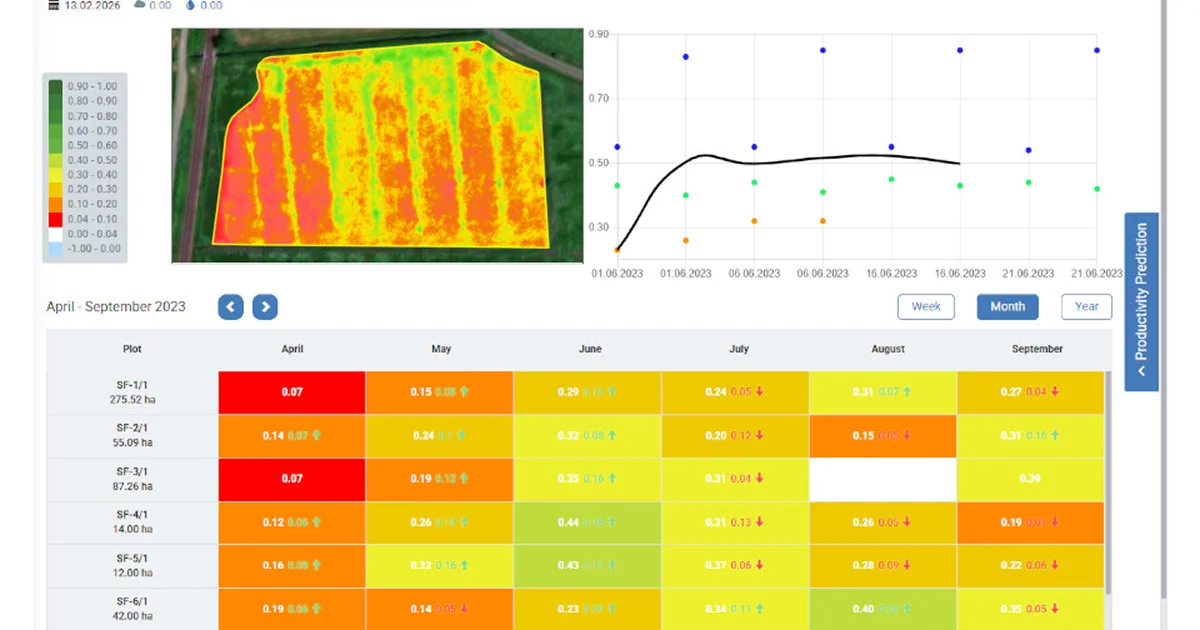
The web service offers an NDVI-based field monitoring system using satellite data, which helps monitor crop conditions throughout the growing season.
Our solution includes:
– regular NDVI maps for each field;
– automatic data updates;
– identification of problem areas (stress, uneven emergence, damage);
– analysis of crop development dynamics over time;
– convenient access to data via an online platform from any device.
NDVI maps are updated automatically and allow you to quickly respond to changes in the field without the need for constant site visits. No complicated settings—just clear data for decision-making.
When choosing a weather station, you need to know its functional capabilities and what they can be used for. They are actively used in all areas of activity, so it is recommended to choose models that are designed specifically for agriculture. In this case, all data is stored on the server and can be obtained in the form of tables and reports anywhere in the world.
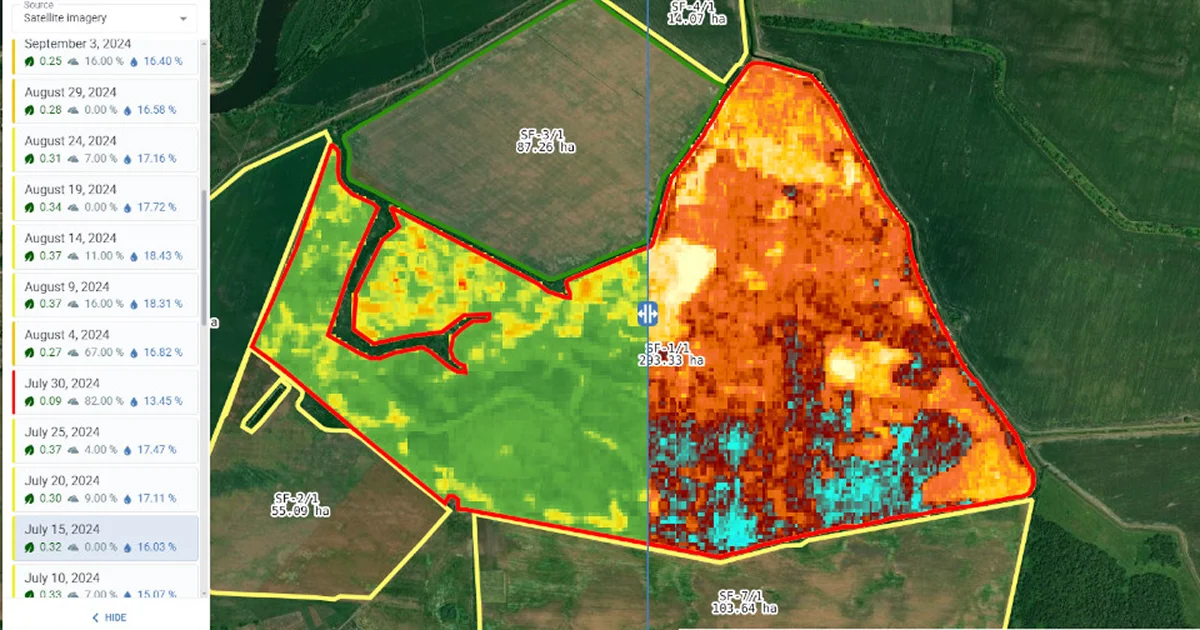
In Agroxy, it’s easy to collect and compare satellite images. There’s no need to include all of your farm’s fields—you can request images for specific geographic areas only. You can view the images online or download them in .kml or .pdf formats. These files can then be easily exported for use in external systems, including Google Earth.
Using NDVI offers a number of practical benefits:
– early detection of problems (stress zones, moisture deficiency, diseases, or pest damage in the early stages);
– cost optimization (the ability to apply fertilizers, pesticides, and irrigation in a targeted manner reduces resource waste);
– increased yield (timely response to problems helps preserve yield potential);
– objective analytics (NDVI data helps evaluate the effectiveness of agricultural technologies and make informed decisions for future seasons).
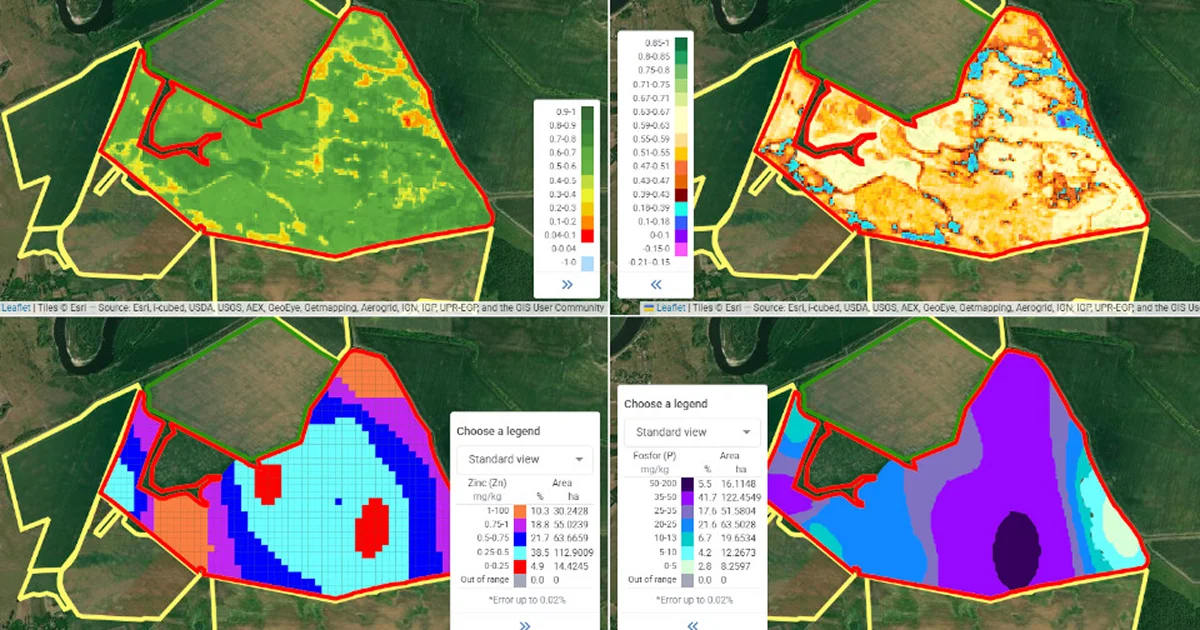
Agroxy provides tools for automated analysis of satellite data, including the identification of areas with varying levels of plant growth, and allows users to organize images by field, crop, or time period. Based on this data, it is possible to identify problem areas or high-yield zones where it is advisable to adjust fertilizer application rates, as well as to generate digital prescription maps for agricultural machinery. Such maps are used in precision application technologies. A comprehensive approach to data analysis when creating task maps helps optimize the use of fertilizers and plant protection products, reduce production costs, and prevent the negative consequences of excessive impact on crops.
Use modern technologies to manage your crops more efficiently, reduce risks, and increase profits this season.